Profit Margin Analysis: How to Find Out Which of Your Products Is Actually Losing Money
The classic mistake: "this product sells well, so it must be making money." Revenue and profit, however, are two separate metrics — and at the product level they often point in opposite directions.
The three levels of profit
What's left after the purchase price
Selling price minus purchase price. The most superficial number, yet most people stop here.
Gross profit
Sales minus VAT, the purchase price and the order's direct costs: shipping, payment fees and ad spend. This shows how much a product or order contributes toward covering fixed costs.
Net profit and margin
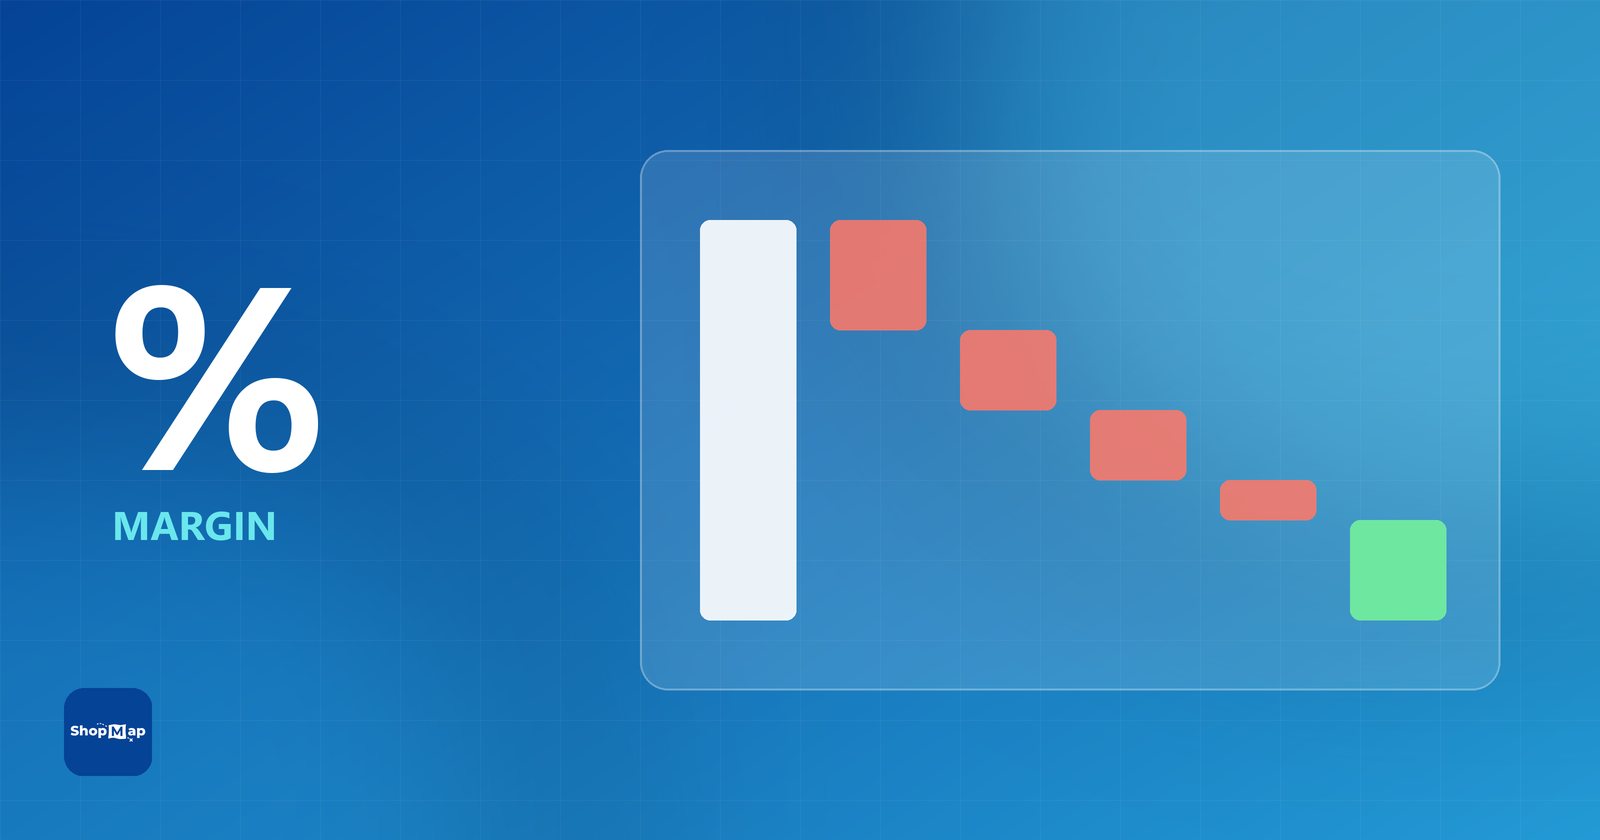
Gross profit minus your expenses (packaging, software, salaries, warehouse). Margin is net profit as a percentage of revenue. For comparison: in publicly listed retail, net margin is typically 5–6% — (NYU Stern, Damodaran: Margins by Sector; U.S. public-market data, not a Hungarian SME benchmark).
How should you sort your products?
By profit after all costs, not by revenue. A practical split:
- Scalable: profitable, worth spending more on.
- Needs optimization: price, shipping or ads need adjusting.
- Loss-making: in the red after all costs.
For loss-making products, it's worth checking why: deep discounts, units given away, many returns, the ad spend linked to the product, or simply that nothing is left after VAT, the purchase price and shipping.
Illustrative example: two products, two different worlds
The table below contains illustrative, made-up figures — it demonstrates the logic, not an industry average.
| Metric | Product A | Product B |
|---|---|---|
| Selling price | 12,990 Ft | 4,990 Ft |
| Purchase cost | 6,500 Ft | 1,800 Ft |
| Margin on purchase price | 50% | 64% |
| Shipping + packaging | 1,200 Ft | 1,100 Ft |
| Payment fee (1.5% + 85 Ft) | 280 Ft | 160 Ft |
| Return rate | 4% | 18% |
| Estimated net margin | ~34% | ~11% |
Product B looks better on paper (64% margin on purchase price), yet in reality it generates significantly less: the fixed-style shipping and packaging cost hits a low-cart-value product disproportionately hard, and the high return rate further erodes the result.
What should you do now?
- Rank your products by net profit over the last 90 days, not by revenue.
- Go through the loss-making ones: some items may be worth discontinuing or repricing.
- Shift ad budget toward profitable, scalable products.
- Keep purchase prices up to date — supplier prices and shipping rates change.
With a few dozen products, this can be managed in Excel; with a larger catalog, it can't. ShopMap calculates gross and net profit, margin and ROI per product from your webshop's orders, and automatically tags every product as Scalable, Needs optimization or Loss-making. Under loss-making products it also shows what took the profit. You enter purchase prices (by hand or from Excel); ad spend is counted against a product when you link the expense to that product.
Sources
- A. Damodaran (NYU Stern): Margins by Sector — stern.nyu.edu
- Stripe Hungarian price list (transaction fee) — stripe.com
Frequently asked questions
- What's the difference between gross profit and net profit?
- Gross profit is what's left of sales after VAT, purchase price, shipping, payment fees and ad spend. Net profit also deducts your expenses (e.g. packaging, software, salaries) — that's your real profit, and margin is net profit as a share of revenue.
- How often should you recalculate product margin?
- At least monthly, because supplier prices, shipping rates, and payment fees change continuously.